NLR Data Analytics and Benchmarking
The National Laboratory of the Rockies (NLR) laid the foundation for a next-generation energy platform with more integrated energy information, advanced analytics, and accessible data that can be used in decision-making for their campus buildings, especially laboratories. The new platform will make NLR's operations more resilient, secure, and as efficient and effective as financially possible, as well as providing resources to research teams requiring the use of the laboratory facilities as a test environment.
Many programs and projects at NLR require access to high-quality campus energy data, but the specific nature of the data collection, storage, and analysis needs vary widely across researcher and building operation requirements. The Intelligent Campus platform unifies these disparate elements into a single, well-defined architecture that improves data reliability, standardizes access to energy data and metadata, reduces duplication of development efforts, and reduces the cost of maintaining NLR's energy informatics infrastructure.
Intelligent Campus Platform
The development of the Intelligent Campus platform is ongoing. The first step was to determine the requirements of the platform—both current and future. This led NLR to determine the commercially available software that would meet security needs, use an open source data standard for flexibility, and would be financially possible to procure. Other early steps included, developing standardized practices in IT configuration, meter connection, and metadata and tagging systems.
By putting these structures into place early on the process of developing this energy informatics platform, NLR ensured data analytics could be accessed by numerous systems, integrated with various stakeholder requirements, and structured to provide accurate and defensible reporting. For example, NLR has chosen to use Project Haystack for tagging infrastructure.
While Project Haystack doesn't have every single tag NLR uses or may want to use in the future, it represents a community of practice with consistent nomenclature for a large portion of the building automation system tags NLR use. As the number of sensors and meters pulled into the fault detection and diagnosis system grew to thousands, Project Haystack was an essential part of ensuring data consistency and accuracy in tagging that made benchmarking and monitoring much easier.
The Intelligent Campus platform develops key capabilities at NLR, including consolidation of energy information infrastructure, broad data access that enables innovative research and improved operations, and standardized metadata to facilitate the deployment of advanced data analytics.
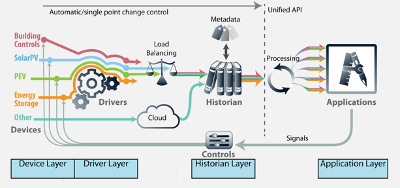
Functional layers of the Intelligent Campus system. Credit: Marjorie Schott, NLR
The campus data collection infrastructure is composed of functional layers, as shown above.
Values are collected from sensors and control devices in the Device Layer (e.g., building automation controllers, electricity meters, solar PV inverters, and energy storage systems). These devices are read by protocol-specific clients in the Driver Layer. These normalized values are then stored in a time series database in the Historian Layer and finally consumed by diverse use cases in the Applications Layer.
Data access for application is provided by a single, unified application programming interface (API) that follows the Project Haystack standard. Errors can be introduced in any layer and contribute to inaccuracy as the data flows upstream. Each subsection of the Intelligent Campus platform has key data quality concerns and technical and procedural requirements to mitigate them.
NLR developed a data quality desk procedure to understand, maintain, and continuously improve the accuracy of data derived from the Intelligent Campus platform. Technical requirements represent needed Intelligent Campus hardware and/or software specifications, while procedural requirements summarize staff policies and procedures defined to standardize human involvement in the setup and maintenance of the sensor architecture. The desk procedure will require further updating, revisions, and enforcement as the system expands. In developing this system, NLR also took the time to consider relevant questions about data, sensors, meters, and equipment, including:
- Determining what should be measured and how to measure it
- Identifying tasks and stakeholders required to ensure all relevant data has been collected to meet reporting requirements
- Establishing records of units, costs, or other specifications needed to define all data points
- Creating descriptions of data sources and methods of obtaining data
- Specifying start dates and time periods for collection (i.e., hourly, daily, monthly)
- Quality assurance and quality control of collected data.
The Application Layer consists of all high-level analysis and supervisory control tools that rely on collected building performance data. Examples include dashboards, benchmarking and reporting software, and fault detection and diagnosis tools. Applications query historical data from the historian and may also read real-time data directly from the drivers. Instead of enumerating the specifics of each application, NLR's requirements development process targeted two main sources of overhead in application development: locating relevant energy data resources and integrating them with application code.
Metadata improvements at the Historian Layer accelerate resource location, while standardized data access enables a wide suite of applications to interface easily and effectively with the lower-level layers via an open, documented API that serves the time series data with rich context surrounding it. This method provides access to information at all levels of the organization to reduce energy consumption, improve safety, and increase transparency in laboratory spaces and across all facilities.
Applying Energy Informatics
NLR uses several systems to conduct benchmarking on buildings, systems, devices, and other equipment. Portfolio Manager is currently used to track building energy and water consumption on a monthly basis. As NLR develops more sophisticated dashboards in the Intelligent Campus platform, those systems will be used to track ongoing building performance.
The list below summarizes the key use cases referencing the application of energy informatics data from the Intelligent Campus platform in NLR's facilities.
- Greenhouse gas reporting
- Utility dashboard for energy management
- Energy reporting tool
- Building operations and control
- Building systems fault detection and diagnosis
- Central plant operations
- Electrical distribution system operations
- Research Support Facility net zero energy measurement and verification
- Fault detection and diagnosis laboratory directed research and development projects
- Energy Systems Integration Facility tenant billing
- Facility dashboards.
Using the Intelligent Campus platform and multiple software systems for utility bill management, fault detection and diagnosis, and reporting time series meter data, NLR monitors the overall energy system health. This includes specific systems such as the central plant or specific processes like ventilation per unit of floor area (cfm/ft²) in laboratory spaces.
By first using analytics, best practices, and experts to determine baseline information, NLR can monitor system performance on an ongoing basis. As systems expand, buildings change uses, or other changes happen, NLR can also adjust system expectations and benchmarking to reflect these changes to more accurately capture energy consumption and performance. The use of accurate metadata and tagging, strong system architecture, and time spent identifying benchmarking needs both from an operations and research perspective allows for these uses within the system.