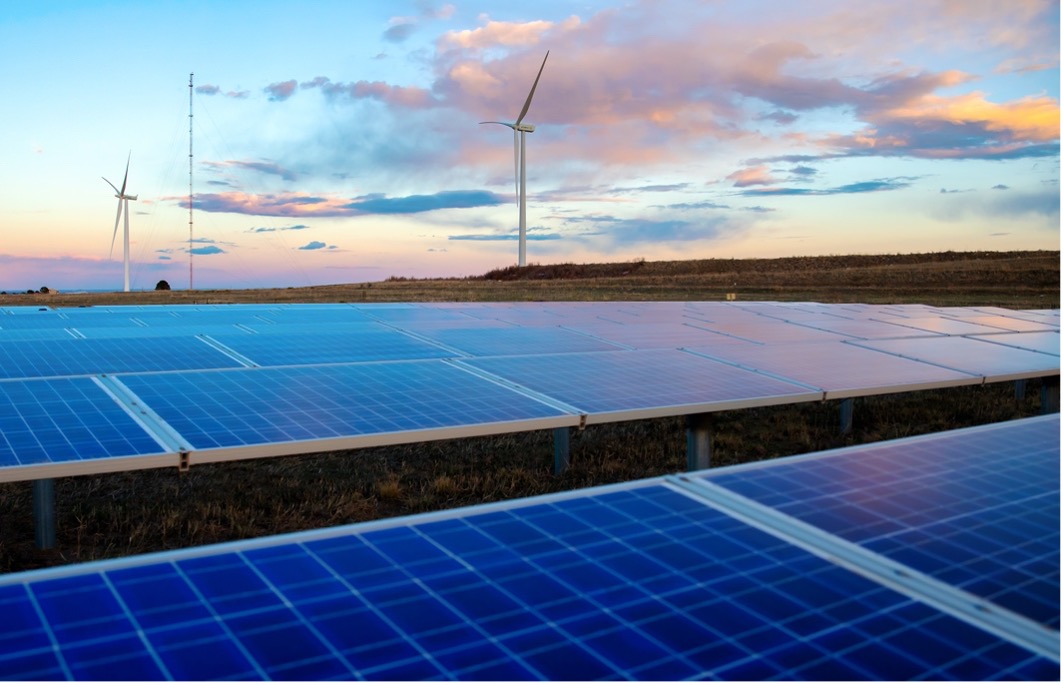
Photo Credit: Werner Slocum / NREL
Decarbonization is the call and process to remove carbon emissions from an organization's systems, including in the construction of new buildings and technologies as well as their operations. Decarbonization is critical to minimizing the impact facility operations have on climate change. Decarbonizing laboratories ensures that science is being conducted in a sustainable manner, and there are many decarbonization opportunities in lab spaces. This page outlines strategies for reducing emissions through laboratory operations that can be incorporated into each phase of the Smart Labs process.
Plan
Develop a Decarbonization Roadmap
Roadmap Examples
To gain a better understanding of what this process looks like, consult the Net Zero Labs Pilot: NREL Roadmap to Decarbonization
The Smart Labs team should develop a plan for including decarbonization into Smart Labs efforts across the campus. Working with facilities staff and organization management is vital towards defining goals for emission reductions and prioritizing decarbonization methods. A few questions to consider while planning:
What are your organization's existing decarbonization strategies and goals?
The Smart Labs team should ensure that their campus decarbonization plan is in alignment with the organization's existing decarbonization strategies and commitments to ensure continued support from organization management and other stakeholders. Assessing the status of prior or ongoing decarbonization efforts can help an organization determine what lessons can be learned from them.
For example, knowing the energy utility’s current decarbonization plan can significantly influence the organization's own plan if it is on a different timeline. If the facility intends to become carbon-neutral by an earlier deadline than the utility, alternative means may have to be pursued to reach decarbonization, such as expanding on-site renewable generation, green power purchase programs if available or purchasing carbon offsets.
Employee Commitment to Decarbonization
Employee personal engagement can contribute to decarbonization efforts. Responsive facility staff can be involved in energy saving initiatives, such as remembering to shut the sash on fume hoods when not in use.
Employee decarbonization efforts can be encouraged off-site as well. The team should ask: is the facility easy to reach through public transportation? If so, the organization could encourage the use of public transportation by actions such as subsidizing employee public transportation passes. Would employees be responsive to campaigns encouraging carpooling? Does the campus provide spots to charge electric vehicles? These are all important considerations to examine when creating a decarbonization roadmap.
What published decarbonization resources and guidelines can be used in the planning process?
Considering Climate
The Climate Explorer is an online tool that projects how climate is predicted to change in a given region of the United States. This is a significant resource to consult when planning and incorporating climate resilience into a final Smart Labs program.
The Smart Labs team should look at peer organization efforts that have been successful to determine how the team and the organization are going to prioritize decarbonization strategies and goals. Implementing and tracking smaller successful projects can in turn build momentum and marshal resources to implement larger decarbonization efforts.
Many factors go into designing a decarbonized laboratory, and the Smart Labs team will need to carefully consider each of these factors to decide which resources will help an organization the most during the planning stage. Every facility has its own unique needs, and as such, its own challenges towards achieving decarbonization.
What are the regulatory compliance standards your organization needs to follow?
Many organizations, including those with labs, are required to report greenhouse gas (GHG) emissions either through state, local, or federal requirements. Quantifying GHG emissions is one of the first steps in reducing an organization's carbon footprint. Baseline GHG emissions allow researchers to evaluate efforts, compare laboratory technologies, and track progress on meeting decarbonization goals.
Federal Site Sustainability Plans
Federal site sustainability plans make a great example on how to use compliance as a benchmarking method. Federal agencies are already required to submit annual plans on how they intend to minimize their activities’ impact on the environment, and Execute Order 14057 has added GHG to the agency's list of considerations. EO 14057 requires agencies to achieve:
- 100% carbon pollution-free electricity (CFE) on a net annual basis by 2030, including 50% 24/7 CFE
- 100% zero-emission vehicle acquisitions by 2035, including 100% zero-emission light-duty vehicle acquisitions by 2027
- A net-zero emissions building portfolio by 2045, including a 50% emissions reduction by 2032
- A 65% reduction in scope 1 and 2 GHG emissions from Federal operations by 2030 from 2008 levels
- Net-zero emissions from Federal procurement, including a Buy Clean policy to promote use of construction materials with lower embodied emissions
- Climate resilient infrastructure and operations, and
- A climate- and sustainability-focused Federal workforce.
Carbon pollution-free electricity
EO 14057 defines CFE as the electrical energy produced from resources that generate no carbon emissions and is fundamental to any organization’s decarbonization plan. See the Federal Energy Management Program website for more information on how a Smart Labs team can assess, strategize, and implement CFE strategies.
These requirements directly inform the actions, goals, and deadlines federal teams can set when they define their Smart Labs programs in addition to the agency's site sustainability plan.
There are many voluntary agreements organizations can participate in as well, either through the U.S. Environmental Protection Agency (EPA) or various non-profits. These agreements are an innovative opportunity for an organization to get pushed down the path of decarbonization and work towards a shared goal while creating a network of resources and experts to solicit advice from.
Which decarbonization metrics should my team use?
After establishing the program’s decarbonization goals, the Smart Labs team should consider the building documents required to create a resource usage baseline. Unlike establishing a baseline during the Assess phase of the Smart Labs process, the resource usage baseline is a preliminary assessment of the laboratory’s carbon footprint. The resource usage baseline should be as complete as possible with the available building documents the team can collect. Organizing this information early in the planning stage will assist the team in gathering the appropriate information during the Assess step.
Common decarbonization metrics the team should consider include:
- Carbon emissions
- Energy savings
These metrics are the industry standard when developing decarbonization policies, which will make it easier to compare baselines to other organizations.
The social cost of carbon can also be considered for incorporation into the decarbonization plan, measuring the marginal damage caused by carbon. The social cost of carbon fluctuates every year and can vary depending on the institution.
For general information on how to frame metrics within a Smart Labs plan, visit the Develop a Plan section under the Plan page of the Toolkit.
Establish a Baseline
Establishing an initial baseline of current operations is a critical step in the path to decarbonization. This baseline will help the Smart Labs team to work towards its decarbonization goals and provide a reference point for success along the way.
Conducting a Scope 1 emissions assessment
Start by assessing the site’s energy consuming equipment, planned projects, long-term real property plans, and any planned major operational changes at the site. The Smart Labs team should use this process to document which buildings and machinery contribute the most to the facility’s Scope 1 emissions.
Fuel consumption data in this regard can readily translate into emissions from direct combustion data using standard engineering formulas. Online tools like the EPA Greenhouse Gas Equivalencies Calculator can give the team an approximation of this conversion.
Conducting a Scope 2 emissions assessment
It is important to determine early on whether the Smart Labs team will want to use the location-based or the market-based method to assess Scope 2 emissions as it will impact how the organization sets its energy benchmarking.
For the location-based approach, the EPA offers a broad spectrum of tools under its Emissions & Generation Resource Integrated Database (eGRID) that can help the Smart Labs team assess the facility’s Scope 2 emissions based on its regional location.
If the team decides to take a market-based approach to conducting a Scope 2 assessment, it will need to collect an inventory of any allowed contractual instruments that can lower the facility’s Scope 2 emissions. Any energy loads, however, that cannot be covered through an instrument will require an assessment of the leftover residual mix, during which the location-based approach will come in handy.
If possible, the Scope 2 assessment should also include the local utility’s short and long-term plans for changes in its generation methods. These may be available in the utility’s Integrated Resource Plan or can be determined by talking to an account representative at the utility. Otherwise, NREL’s Cambium data sets contain hourly emission, cost, and operational data for modeled futures of the U.S. electric sector with metrics designed to be useful for long-term decision-making.
Conducting a Scope 3 emissions assessment
While some emission sources, such as transportation, can be derived from surveys and business travel patterns, other sources are more ambiguous to quantify, and the Smart Labs team may encounter significant informational barriers in this endeavor.
Early steps to tackle Scope 3 emissions should involve identifying the various upstream and downstream activities that could be contributing to the facility’s Scope 3 emissions. The GHG Protocol Scope 3 Evaluator is a tool that helps organizations screen their operations in order to pinpoint areas in their value chain that could be contributing to the organization's indirect GHG emissions. The EPA has also developed the Simplified GHG Emissions Calculator for small businesses and low-emitter organizations to use in order to track and calculate all three scopes of their GHG emissions, using approximate models and standard calculations.
Assess
Understand carbon emissions metrics
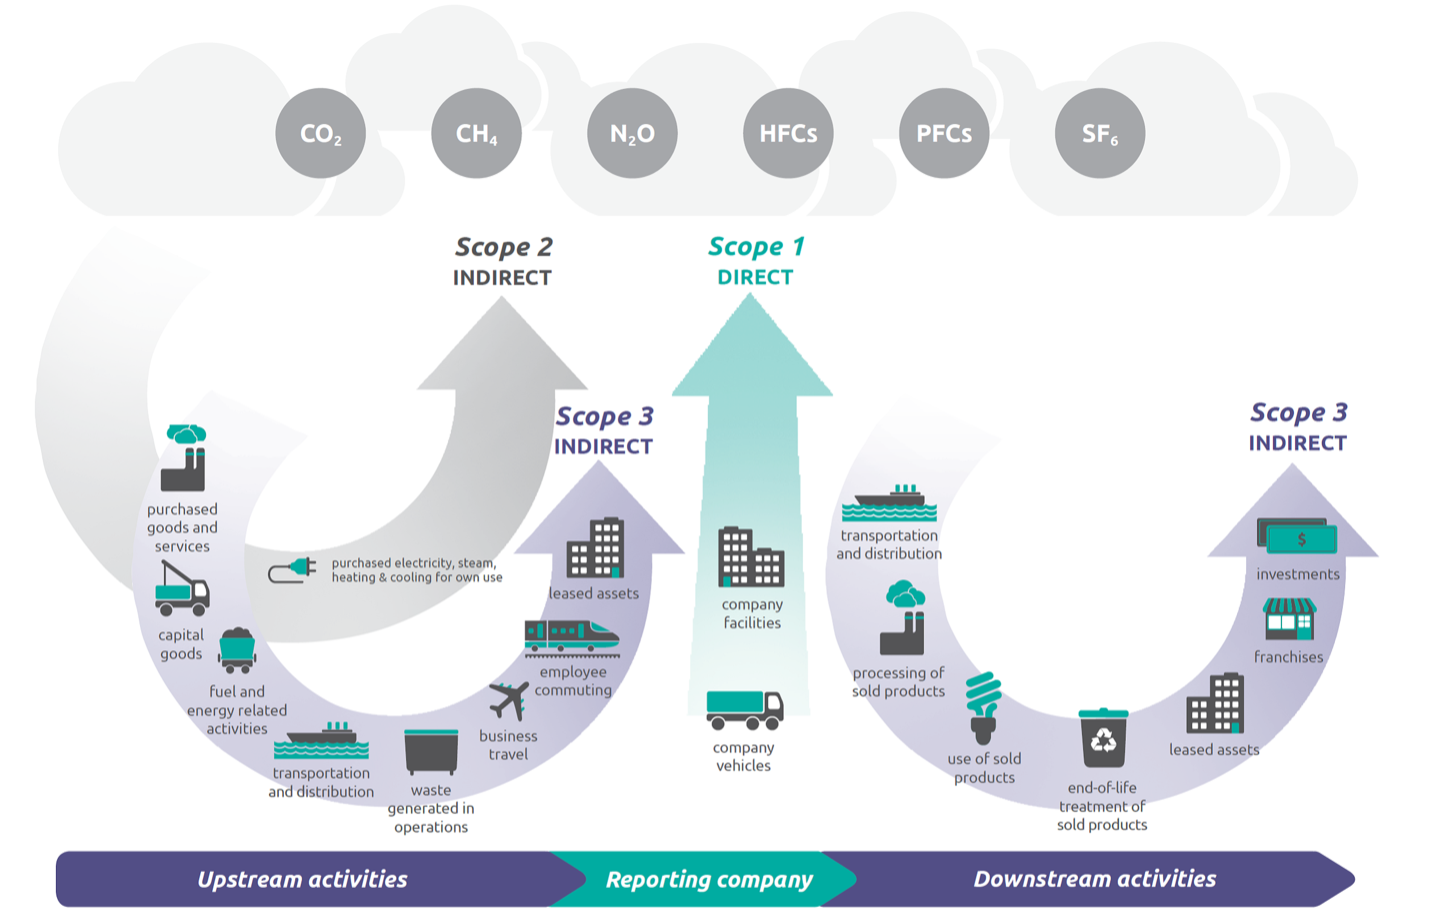
Photo Credit: WRI/WBCSD Corporate Value Chain (Scope 3) Accounting and Reporting Standard (PDF)
Before gathering data on carbon emissions, it is important to understand how to inventory greenhouse gas emissions by scope.


Scope 1
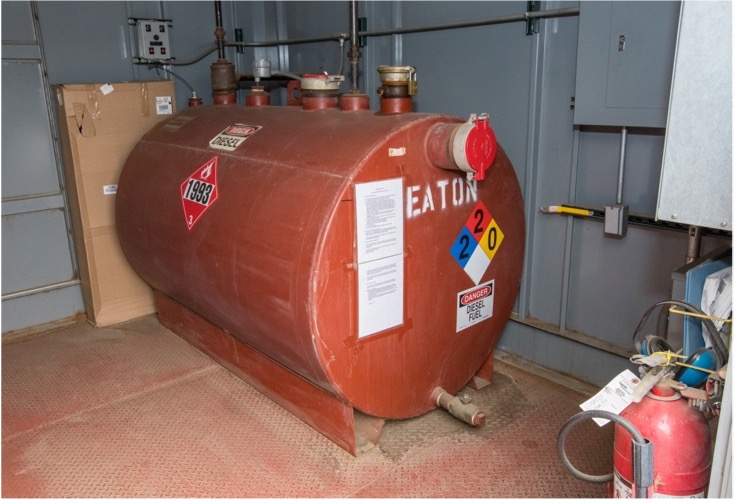
Photo Credit: Werner Slocum / NREL
Scope 1 emissions refer to any GHG emissions that take place directly on the facility’s site. The most substantial source of Scope 1 emissions is the direct combustion of fossil fuels.
Common fuels to consider include:
- Natural gas
- Diesel
- Gasoline
- Fuel oil
- Biomass (in some cases)
Common emission sources include:
- Facility operations for normal use: Depending on the HVAC system the building operates, most facilities own an on-site furnace or water boiler to generate and distribute heat across lab and non-lab spaces. These heating technologies often consume fossil fuels, which is supplied to the building by a regional utility and can account for the largest portion of a facility’s Scope 1 emissions. In a laboratory setting, HVAC systems can represent up to 85% of the total energy used. This is because labs have a need for higher air volume ventilation, due to the nature of the experiments or containments that take place within the facility. For more information about how this works, visit the Assess section under the Toolkit.
- Back-up generators for emergency use: Even though back-up generators are only used in emergencies, generators must be run periodically for maintenance and reliability, which can contribute to the GHG emissions on-site. As such, organizations focused on decarbonization should consider alternative modes of back-up generation. This can include biofuel-based generators, hydrogen fuel cells, or carbon-free stationary batteries.
- Company vehicles: Most cars in the U.S. run on gasoline. If an organization operates a vehicle fleet either for personal use, such as a company car, or for public use, such as a shuttle, then these GHG emissions will need to be included in the team’s Scope 1 assessment. Fossil-fuel based vehicles can be replaced overtime with sustainable alternatives, such as electric or green hydrogen fuel-based cars.
Other on-site sources to consider include fugitive emissions, which can occur from the direct operation of machinery in addition to various other opedrations:
- Leaked refrigerants: When cooling equipment gets installed, repaired, damaged, or removed, refrigerants can escape and contribute to a facility’s direct GHG emissions. Many refrigerants contain hydrofluorocarbons (HFCs) and even perfluorocarbons (PFCs), which have a high global warming potential value due to their intense heat-trapping properties.
- Chemical usage: Many laboratories engage in chemical usage every day and can have a measurable carbon footprint from these activities, depending on the function of the lab. Common sources of GHG emissions from laboratory activities include:
- Fire extinguishers
- Experiments that involve chemical reactions
- Cleaning solutions for laboratory equipment.
Scope 2

Photo Credit: Dennis Schroeder / NREL
Scope 2 emissions refer to GHG emissions that result from the facility’s activities but only occur indirectly as the sources that create the emissions are owned or controlled by a different organization.
Scope 2 emissions commonly come from purchased electricity, and sometimes steam for heat and chilled water to cool the building, but the sources of emission are usually owned and controlled by a utility company or other power-generating entity. Scope 2 emissions represent one of the largest sources of emissions globally as electricity and heat generation account for at least a third of the world’s total GHG emissions.
Because the sources of emission are not controlled by the organization, accurately estimating Scope 2 emissions can be challenging since every utility has a different emissions profile. There are two methods to consider when calculating Scope 2 emissions:
- Location-based approach: This approach quantifies Scope 2 emissions by calculating the average GHG emissions from the electrical grid at a specific location. The emission factors employed can be local, regional, or national, depending on how the location boundary is defined. This approach is the most widely used and is great for default approximations.
- Market-based approach: This approach quantifies Scope 2 emissions by looking at the organization’s contractual obligations with different energy generators to determine how many GHG emissions they individually contribute. Contractual obligations include renewable energy certificates (RECs) and power purchase agreements (PPAs). This approach is useful for organizations when they want to measure their individual procurement actions and are large enough to influence the electricity market.
Scope 3
Scope 3 emissions refer to all other emissions not covered by Scope 1 and Scope 2. They are GHG emissions that occur through an organization’s respective value chain, where its activities extend beyond the scope of an organization’s ordinary operations. Scope 3 emissions are not directly under the organization’s control, but they often make up most of an organization’s total GHG emissions.
Organizational activities that can indirectly contribute to a facility’s Scope 3 emissions can be identified both upstream of the value chain and downstream.
Upstream activities address materials, inputs, and services that flow into the organization. Examples of upstream activities within laboratories include:

Photo Credit: Dennis Schroeder / NREL
- Employees commuting to and from the facility
- Business travel for various events and conferences
- Capital goods and their associated GHG emissions from the manufacturing and transportation; this involves any energy used or any waste produced in the process. Common capital goods found in labs consist of:
- Laboratory equipment
- Food and drinks
- Appliance technology
- Information technology
Downstream activities address materials, outputs, and services that flow out of the organization. Examples of downstream activities within laboratories include:
- Manufacturing and transportation of project deliverables
- End-of-life treatment of various products and capital goods
- Investments in subsidiaries, associate companies, or joint-ventures and their associated GHG emissions
Identify Improvement Measures
After establishing an emissions baseline, the Smart Labs team can set reduction goals and identify actions that will help the facility get closer to decarbonization. Noticing any trends or patterns of significant energy consumption, for example, is a promising area to start as massive energy usage can mean unlocking massive energy saving opportunities.
One way a Smart Labs team may approach identifying improvement measures is by consulting an energy management system (EnMS). An EnMS is a process for integrating energy management into existing business systems, enabling organizations to better manage their energy and sustain achieved savings. The global standard for EnMS is ISO 50001, an international standard created by the International Organization for Standardization (ISO) to systematically identify energy efficiency measures and integrate them continuously.
Per Section 1002(g) of the Energy Act 2020, federal facility energy managers are already required to take into consideration the use of an EnMS to manage energy and water use as well as the applicability of certification for the facility in accordance with ISO 50001. The Department of Energy developed a 50001 Ready Checklist and Training Program to assist agencies in complying with the Act and, even for non-federal facilities, in developing EnMS plans.
Optimize
Four Pillars of Decarbonization
The four pillars of decarbonization are themes that have been recognized throughout decarbonization literature to describe the necessary actions and improvements institutions must make to achieve a net-zero energy future.
 Energy Efficiency
Energy efficiency is one of the most significant pillars to start with when implementing a decarbonization plan. Energy efficiency initiatives reduce a building’s energy loads, which in turn reduces an organization’s dependence on fossil fuel combustion, both on- and off-site. Energy efficiency strategies can effectively target Scope 1, Scope 2, and Scope 3 emissions while maintaining laboratory safety.
Establishing the facility’s emissions baseline will likely reveal that one of the first ways the Smart Labs team can reduce energy demand is through the laboratory’s HVAC system. These strategies include:
- Considering space consolidation and remote work opportunities when appropriate,
- Ensuring HVAC system controls use current occupancy levels—if building occupancy has changed, schedules and setpoints need to be revisited,
- Confirming regular maintenance is being performed on equipment: HVAC filter replacement, general preventative maintenance, etc.
These strategies complement many of the Smart Labs principles discussed in the Assess and Optimize sections of the Toolkit.
Other equipment-based load reduction opportunities include:
- LED lighting upgrades
- Occupancy and daylight sensors
- Variable frequency drive pumps and motors
- HVAC control upgrades
- High-efficiency chillers, compressors, fans, and pumps
- Building envelope repairs & upgrades
- Pipe, wall, and roof insulation.
Emission reduction opportunities also exist outside of energy conservation measures.
Water efficiency. The EPA estimates that drinking water and wastewater systems account for approximately 2% of the energy consumed in the U.S. This adds over 45 million tons of GHG to the atmosphere a year. Most of this energy is spent on pumping water, which in labs, can be an especially energy-intensive process. Areas to consider implementing water efficiency strategies in laboratories include:
- Equipment cooling: Single pass cooling systems can use up to forty times more water than a cooling tower, so there is a huge potential for water reduction. Switching to energy efficient cooling methods like a cooling tower usually has a short payback period and can provide a quick win. Even reusing the water from a single pass cooling system or optimizing its flow accordingly can unlock massive water and energy savings.
- Steam sterilization and autoclaving: These systems can use between five to fifteen gallons of water per minute when they are running. Turning off any steam sterilizers or autoclaves when they are not in use can save a significant amount of water and energy. The waste from these systems can also be recovered in the building as grey water, further reducing the energy demand placed on these systems. Labs have to condense steam water to below 140°F before discharging it into the sewers.
- Washers: When purchasing a new washer, consider both the age and the size of the appliance. Every year, washers are designed to be more energy and water efficient and can even be programmed to recycle the final rinse water for the next load. Make sure the washer’s size meets the needs of the lab to encourage the number of full loads being run. The Smart Labs team can also encourage laboratory staff to run washers only when they are full.
For more information, consult the I2SL Best Practices Guide: Laboratory Water Efficiency.
- Laboratory chemical usage. Reducing the number of fire-related incidents will greatly reduce the GHG emission at the lab from fire suppression equipment while increasing overall laboratory safety. This can be achieved through common-sense training and adequate storage of fire hazardous materials in addition to proper ventilation. Consult either the facility’s fire safety plan or the facility’s fire compression engineer to see if there are any areas for improvement.
The Conduct a Laboratory Ventilation Risk Assessment section of the Toolkit offers more information on laboratory safety as well, and how the Smart Labs team can use Safety Data Sheets to make an informed decision when assessing a laboratory’s potential GHG emissions. The Green Chemistry section of the Working with Scientists page can also provide resources on how the team can potentially replace toxic and climate-warming chemicals with more sustainable alternatives.
Electrification
Electrification is the process of converting technologies that have historically relied on gas and other fossil fuels into technologies that depend on electricity instead. There are several fossil fuel-based technologies at a facility that can be electrified. Some of the most common technologies include:
- Furnaces
- Water heaters
- Water boilers
- Vehicle fleets
Electrification is becoming an increasingly important way to optimize decarbonization as it can eliminate a significant portion of Scope 1 emissions.
It is important to note that for the largest energy savings, electrification technologies should be pursued in coordination with each other and additional energy efficiency technologies. The benefits of both strategies can have a compounding effect and can be used to achieve the greatest decarbonization outcomes. Heat pumps and waste reuse systems, for example, reduce the energy demand placed on a building when compared to electric resistance heaters.
While a deferred maintenance plan is an attractive approach to ensure proper project coordination, even taking small steps, such as replacing units with electrified equipment as they break, can lead to measurable steps in the right direction during the optimize stage.
Building Electrification for Heating

Photo Credit: Rachel Romero / NREL
Electric resistance heaters and water boilers are 100% energy-efficient, meaning that 100% of the appliance’s electrical energy is used to generate heat. Electric resistance heating can efficiently warm a laboratory in a sustainable manner, so long as its power comes from a clean energy source.
Electrification, however, can often be more expensive than traditional heating appliances since energy is lost during the generation and transmission process. This is especially true if an organization receives its electricity from a distant power source through a utility provider. Fossil fuels in comparison do not lose as much energy in the transmission process since they are combusted on-site. Knowing the number of heating degree days (HDDs) in a facility’s region can help the team reasonably predict the cost of making the switch. Information about regional HDDs can be found under EIA.
Electrification, though, is not the only type of technology to consider when looking to reduce the facility’s carbon footprint. Low-energy heat pumps are a cost-effective and reliable method to heat laboratories, requiring less than 50% electrical energy compared to electric resistance heaters. Heat recovery chillers, which produce heat while providing cooling, and waste heat reuse systems should also be actively considered when creating contemporary designs for new buildings or retrofitting older spaces.
Electrification for Transportation
Photo Credit: Dennis Schroeder / NREL
Transportation in the United States currently contributes 27% of the country’s total GHG emissions, the largest of any other sector in the economy. Consequently, reshaping an organization’s vehicle fleet around electrification and other sustainable fuel sources has the significant potential to lower both Scope 1 and Scope 3 emissions from the facility’s activities.
Consulting early optimization tools will help since there are different electric vehicle (EV) models to consider. The Fleet Procurement Analysis Tool is one Excel instrument that enables building planners to compare battery electric vehicles (BEVs) and plug-in hybrid electric vehicles (PHEVs) based on their financial viability and environmental impact.
Transitioning employees and company cars to EVs will affect the building’s overall energy load. For more information on the challenges to an EV fleet transition, visit the FEMP Training Catalogue to consult the EV Champion Training Series.
Check out Lawrence Berkeley National Lab's strategies for electrification and establishing a baseline: Lawrence Berkely National Laboratory Efficiently Energizes their Integrative Genomics Building.
Renewable Generation and Storage
Renewable generation is energy that can be produced from a clean energy source, where its supply cannot be depleted, or its supply can be reliably restored. Examples of renewable energy sources include:
- Solar
- Wind
- Hydro
- Geothermal
- Biomass (in some cases)
Renewable energy generation is integral towards achieving decarbonization and represents one of the most critical pillars when considering how to reduce a facility’s Scope 1 and Scope 2 emissions. Renewables may be able to reduce the use of gas-based furnaces or water heaters on-site as well as decrease an organization’s overall dependence on fossil fuels.
On-site Renewable Generation
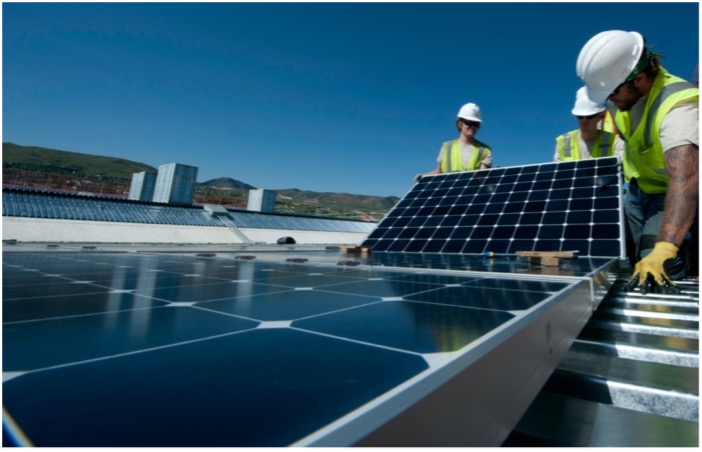
Photo Credit: Dennis Schroeder / NREL
The renewable generation potential of a site is limited by a number of factors, one of the most important ones being its geography.
As such, conducting a site assessment will evaluate the potential for renewables installation. If an organization wants to install a PV system, a site assessment should consider climate and building orientation as well as any obstructions that could cause shading of the PV. While most organizations opt to fit their facilities with a PV system, alternative renewable technologies can also be pursued, depending on the site’s conditions.
There are many tools that can enable users to estimate the energy production from different PV systems based on the information collected during a site assessment. The PVWatts Calculator is an ideal tool for organizations and business owners as it allows users to draw their PV system on a map and estimate their annual generation from a set of adjustable to default values.
It is also important to consider the financial considerations to renewable integration as well as the physical ones. An online tool that assesses the economic viability of renewable energy projects is the Renewable Energy Integration & Optimization (REopt) Tool, which is a techno-economic decision support tool to optimize energy systems for buildings, campuses, communities, microgrids, and more. REopt recommends the optimal mix of renewable energy, conventional generation, and energy storage technologies to meet cost savings, resilience, emissions reductions, and energy performance goals.
Renewable Storage Options
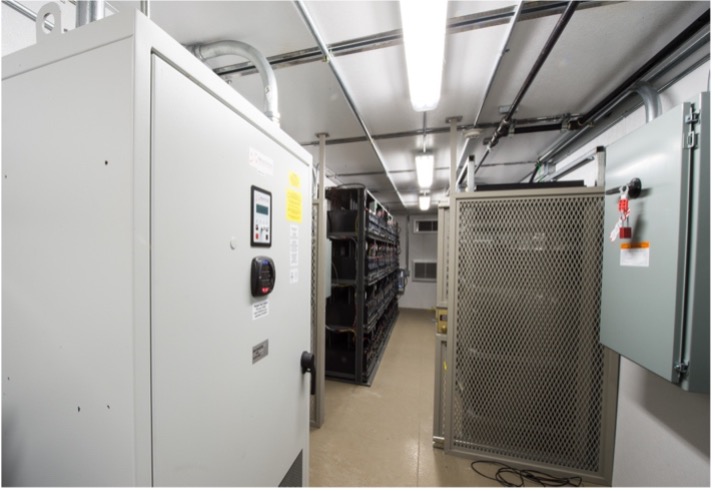
Photo Credit: Dennis Schroeder / NREL
Renewable storage systems capture excess energy production from a facility’s on-site renewables after the building’s current energy demand has been met. These technologies store energy for short periods of time, which can then be released to power the laboratory when renewable generation is low or interrupted.
Common storage technologies include:
- Batteries
- Thermal energy storage tanks
To analyze the potential of renewable storage options at a facility, consult the System Advisor Model (SAM) from NREL, which analyzes different technological pathways to renewable generation, given the facility’s characteristics and regional location. SAM’s financial models also equip the team with the right tools to consider the associated costs of storage, which will optimize GHG reductions at the lowest charge.
Off-site Renewable Generation
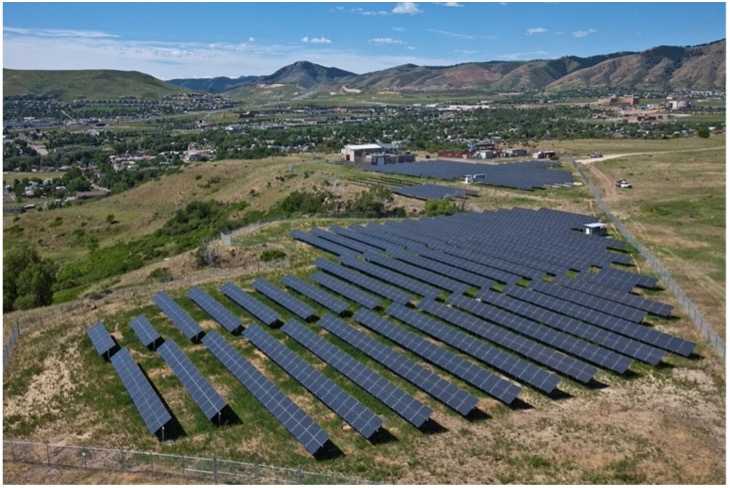
Photo Credit: Dennis Schroeder / NREL
Early assessments may reveal that a facility does not have enough generation and storage capacity available on-site to meet the building’s energy demands. If so, the Smart Labs team should explore options to generate clean energy off-site, which can then be delivered to the organization.
Off-site renewable generation can take many forms and is an attractive approach for laboratories located in buildings that have limited space, such as in urban areas. Deciding to pursue off-site generation can be challenging as the decision will depend on the laboratory’s budget and individual needs. Common mechanisms to consider include:
- Green electricity programs
- Off-site power-purchase agreements (PPAs)
- Carbon offsets
- Renewable energy credits (RECs)
Demand Flexibility and Grid-Interaction
A grid-interactive efficient building (GEB) is an energy-efficient building designed to help an organization procure not just lower energy costs within facility operations but through demand flexibility (DF) as well. GEBs achieve energy savings by employing an Energy Management Information Systems (EMIS), which monitors a facility’s energy consumption during times of grid peak intensity.
An EMIS pulls information from the following data sources to automatically shift a building’s energy loads to less expensive periods:
- Utility bills
- Interval meters
- Weather stations
- Building Automation System (BAS)
- Sophisticated supervisory controls
- Advanced and standard meters/submeters
- Building infrared and motion sensors
- Building security access controls
- Fault detection technology
- Internet of things (IoT) devices
- Distributed Energy Resources
Installing an EMIS in a laboratory can optimize an organization’s energy savings and reduce the overall strain its facility puts on the electrical grid. This in turn reduces the GHG emissions from the facility’s operations since dirtier and more expensive fossil fuel power plants like natural gas peaking plants get called on when electricity demand is at its highest.
This peak-shaving approach, while it does not eliminate GHG emissions, is still a promising opportunity to explore if an organization is interested in taking its decarbonization actions even further. The median payback period for an EMIS is two years.
EMIS is an especially useful mechanism for a Smart Labs team to consider if its organization has any flexibility in terms of its energy consumption. Laboratories can be different from other commercial buildings in that many scientists and researchers are not required to work traditional 9:00-5:00 business hours, depending on the function of the lab. Indeed, some laboratory schedules may be set up in such a way to encourage non-peak energy loads, such as assigning different shifts for when researchers can come in if they share any equipment.
For more information on EMIS and GEBs in general, refer to the EMIS publications under the NREL website or the EMIS resources listed under the Better Buildings Solution Center.
How to Prepare for Peak Demand
Some laboratory equipment operations may be deferred to minimize peak demands or operate during times when the grid carbon intensity is lower. Potential applications include autoclaves and washing systems such as cage washing systems.
How to Determine Peak Demand
The U.S. Hourly Electric Grid Monitor reports changes in national electricity demand as it is happening in real-time and breaks down energy demand by both region and fuel resource type. It is an important resource to consult when determining the feasibility of switching to a load-shifting management strategy. For historic approximations, average hourly peak loads for a region are also available.
Manage
Once the facility’s decarbonization strategies have been executed, the Smart Labs team will want to track and report ongoing GHG emissions to determine further reduction opportunities.
A dynamic management approach will address any remaining challenges the facility may be facing by applying an ongoing re-evaluation of a team’s decarbonization plan, based on the organization’s current progress towards meeting its decarbonization goals. The team should ask:
- Are we seeing the carbon savings we want?
- If no, what needs to change? Formulate a new plan and consult alternative resources. Decarbonization is a massive undertaking for any organization and will require adaptivity and resilience when initial decarbonization strategies and technologies do not work as expected.
- If yes, how can you maintain these savings? Can your team achieve even broader GHG reductions? Documenting and quantifying the organization’s GHG emissions well-after the optimize stage is important not only towards monitoring the facility’s progress, but also towards identifying which buildings and pieces of equipment are still consuming the most energy on-site.
For more information on how to develop a building management plan, visit the Manage section of the Toolkit.
Take Action: Decarbonize Your Labs
- Get the ventilation right in the lab spaces
- Conduct recurring LVRAs
- Modify set points and operating system specifications to optimize HVAC systems
- Consider energy recovery in the form of:
- Exhaust energy recovery
- Heat recovery chillers
- Other sources of waste heat such as data center and sewer pipelines
- Install air source or group source heat pumps