Once the team has a roadmap for the Smart Labs program, the next step is to thoroughly assess the first building on the roadmap. Comparing the baseline performance metrics to design specifications and safety requirements will enable the Smart Labs team to identify appropriate measures and opportunities to optimize laboratory system performance. The goal of the Assess phase is to identify areas in which the lab facility can be improved. Once an assessment process is established, it will be incorporated into the Smart Labs management plan in the Manage Phase and continue to inform areas of improvement in the facilities.
General Guide for Laboratory Building System Assessments
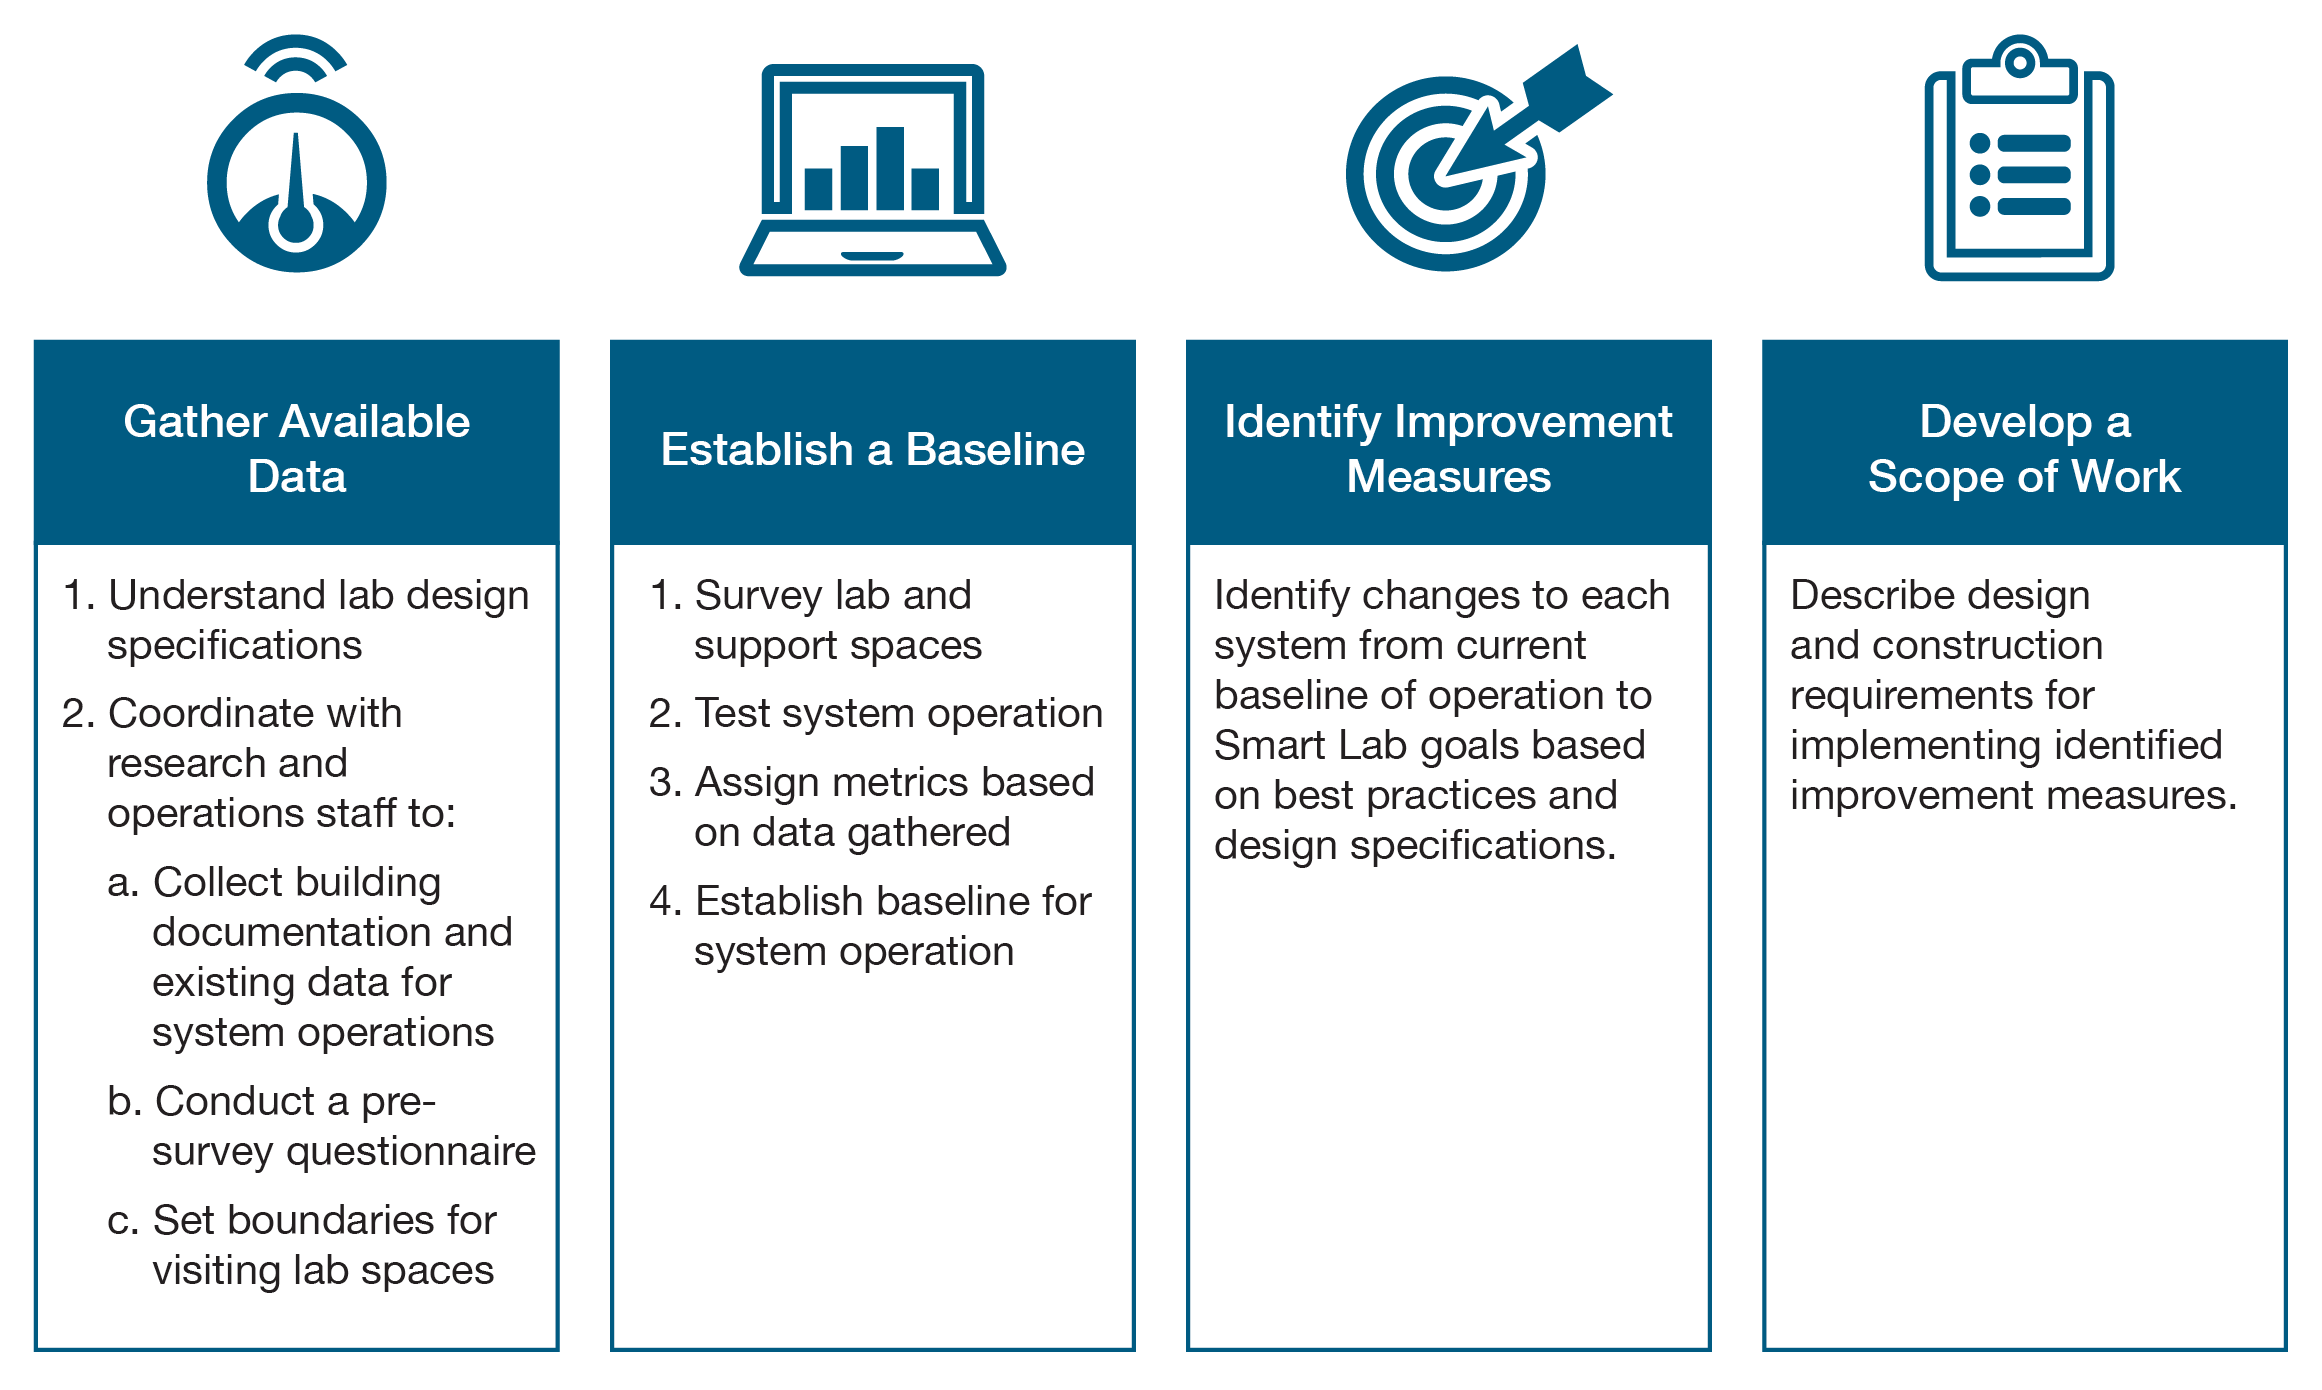
Each laboratory operates under different design specifications and includes different equipment that requires a specialized process for assessment. However, the methodology for each assessment is the same. The following graphic provides an overview of how to perform a system assessment that results in a detailed scope of work. Detailed guidelines for assessing specific systems in laboratory facilities are in the next sections.
Focus on Lab Ventilation
Five Things to Keep in Mind about Laboratory HVAC Systems
First Line of Defense: Air is the primary carrier of heat, moisture, contaminants, and airborne hazards in and around laboratory buildings. As a result, occupant safety is the main driver of laboratory ventilation system design and operation. The system's primary function is to effectively control airborne hazards to meet the needs of occupants and mitigate risk to people, property, and the environment.
High Construction Cost: HVAC systems account for as much as 40% of the cost of constructing modern laboratories.
Energy Intensive: HVAC systems are the largest consumer of energy in a laboratory building, typically accounting for 45% to 85% of total energy use.
Opportunity to Reduce Operational Costs: HVAC systems typically waste energy by exhausting more flow than required.
Management Intensive: HVAC systems require the greatest level of effort from stakeholders responsible for managing and maintaining operation.
Conduct a Laboratory Ventilation Risk Assessment
The Laboratory Ventilation Risk Assessment (LVRA) is a method to provide ventilation designers and laboratory safety personnel with a systematic, effective process to assess risk. Working closely with facility and research staff, environmental health and safety (EH&S) professionals, and industrial hygienists will allow the Smart Labs team to determine lab ventilation requirements based on the evaluation of hazards in several assessment categories.
Labs should be following the ANSI/ASSP Z9.5-2022 standard, which "establishes minimum requirements and best practices for laboratory ventilation systems," such as the components of the LVRA. This documentation is for any laboratory ventilation stakeholders but should include the members of the Smart Labs team.
The following steps are to be used as general guidelines in performing the LVRA. Please note each lab facility has unique hazards that must be taken into consideration on a case-by-case basis. The guidelines are a framework to get the Smart Labs team started in the right direction to perform an initial ventilation risk assessment but may need to be customized for each unique situation. It is recommended to incorporate the LVRA method and testing into an overall facilities management program in order to help optimize the operational effectiveness of labs, enhance occupant safety and comfort, and minimize maintenance and control problems.
Gather Available Ventilation System Data
Understand Design Specifications for Lab Airflow and Air Change Rates
Airflow in Laboratories
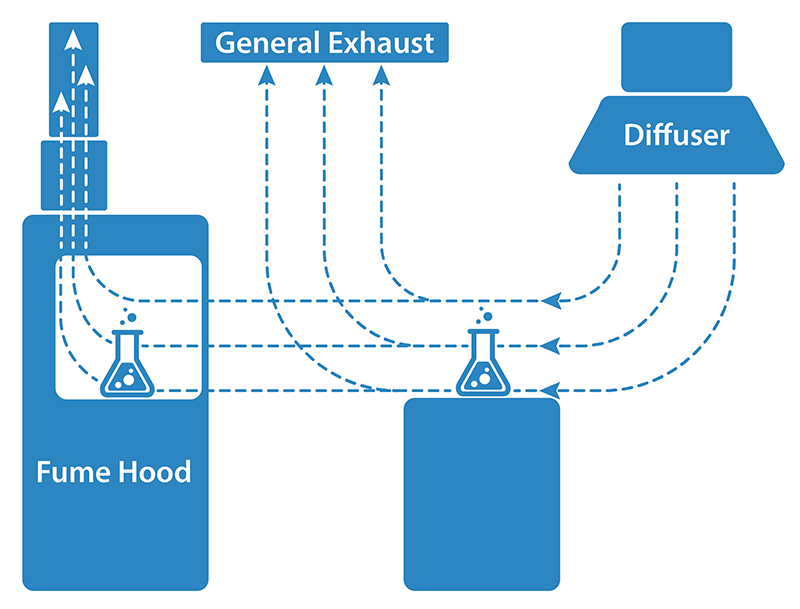
Airflow patterns in lab spaces play an important role in determining the air velocities, air temperatures, and concentration of contaminants which subsequently determine occupant thermal comfort and indoor air quality. Optimizing the flow path can help improve the ventilation effectiveness which can lead to safe, energy efficient, and sustainable laboratories. Unfortunately, lab ventilation systems can be complex, making it difficult to visualize the flow path of air and the resulting flow path of contaminants.
In general, clean supply air should sweep across the space and out exhaust paths, clearing airborne contaminants effectively from the space without significant recirculation or stagnation.
The airflow path can depend on several inter-related factors including:
- Supply airflow rate or air changes per hour (ACH)
- Contaminant type, location, and rate of generation (especially important in the case of ventilation-dominated laboratories)
- Type, location, and quantity of supply diffusers
- Quantity and location of exhaust grilles
- Location and intensity of various heat sources (especially important in the case of cooling-load-dominated laboratories)
- Location and size of exposure control devices (ECDs) (e.g. fume hoods—especially important in the case of fume hood-dominated ventilation)
- Arrangement of furniture and other airflow obstructions.
Specific airflow requirements are key in determining laboratory airflow specifications, including requirements for:
- Effective operation of ECDs
- Occupant comfort
- Maintenance of required differential pressure between adjacent spaces
- Maintenance of required air change rate.
Additional codes and requirements regarding laboratory ventilation are included in the resources.
The minimum amount of air flow in a lab is often defined in air changes per hour (ACH). Traditional design practices often claim higher ACH are better than lower ACH. However, recent studies have indicated that the pattern of air flow in the lab can be more important than the volume of air when trying to minimize occupant exposure [1]. Past specifications for ACH ranged from 4 to 12 for all labs on a campus, while various codes and standards will recommend different values. The 2012 ANSI/AIHA/ASSE/ Z9.5 standard requires that each lab's ACH be established independently based on risk to account for wide diversity in airflow requirements between different labs.
The system can be either constant-volume, variable air volume (VAV), or a combination. VAV systems are recommended for their energy and cost benefits; however, a mix of VAV and constant-volume systems may be a solution for specific facilities.
| Variable Air Volume Systems | Constant Volume Systems |
|---|---|
|
Modulate flow to satisfy the demand for ventilation
|
Provide a constant flow to satisfy maximum demand
|
Coordinate with Operations and Research Staff
The first step to assessing the laboratory's systems is to coordinate with operations and research staff. Engaging with the appropriate staff will assist in gathering building documentation, pre-survey questionnaires, and surveys of lab spaces and systems. Positive relationships with key laboratory personnel are crucial to ongoing maintenance, analytics practices, and dynamic optimization of lab ventilation systems.
Gather Building Documentation
The first step to assessing the laboratory's systems is to collect building documentation. Typical building design and operating documents include:
- Architectural floor plans showing labs, major ventilation devices, and energy consuming equipment
- Mechanical HVAC plans
- Testing and Balancing (TAB) and commissioning reports
- Current airflow control setpoints and sequences from the building automation system (BAS)
- Organization's Laboratory Building Design Guide
- Description of the systems and components that comprise each individual mechanical system
- Description of the control systems, including tables of setpoints corresponding to the system diagrams and summary of known operating sequences that affect modulation and control
- As-built system line diagrams, showing discrete systems including fans, ducts, controls, and devices
- Hazard inventory and waste records
- EH&S records.
Review available building documentation in advance of the field survey so that each space can be effectively, efficiently, and safely assessed.
Importance of Exposure Control Device Documentation
ECDs are the first line of defense for protecting researchers from harmful airborne materials. These include fume hoods, snorkels, downdraft tables, and gloveboxes. Each device comes in multiple types, each designed for a specific purpose and with specific performance criteria that can only be determined by those familiar with the characteristics of the materials and the operation.
It is a fundamental health and safety requirement that ECDs are designed and operated with airflows required to properly perform and contain hazards. Fume hood and other ECD documentation should be included in the overall building documentation plan specifying the conditions under which they effectively operate. ECD documentation should include:
- Instructions for proper use
- Airflow volume required
- Placement of each device.
If this documentation is not available, it can often be found online at the manufacturer's website.
Sash management on ECDs is key. Learn more in the case study on Driving Energy Savings Through Occupant Engagement and Behavior Change.
Of particular note is the effect of an open or closed sash in fume hoods. Typical fume hood use does not require the sash to be open most of the time. When no user is present, the sash should be closed. For VAV fume hoods, the sash is typically closed for most of the day and on weekends. This operating mode should then be optimized to require the lowest amount of airflow that maintains hood containment, dilution, and transport velocity.
Inventory Hazardous Chemicals
Here's an example of a common Safety Data Sheet from Sigma-Aldrich. Additional Safety Data Sheets can be found using the advanced Safety Data Sheet (SDS) search bar on Millipore Sigma.
In collecting a hazardous chemical inventory, gather Safety Data Sheets and document how each chemical is used and disposed of. Once a detailed inventory is created, complete the following:
- Submit a chemical inventory for the building by hazard class to building officials
- Compare the inventory with building code maximum allowable quantities (MAQs).
Conduct a Pre-Survey Questionnaire
Before starting to survey lab and support spaces, it is important to get input from research staff and operations personnel about the workspace. Questions about work performed in each lab space, including procedures, personal protective equipment, and ECDs used will be helpful in orienting the surveyor as to what to expect during the survey. Examples of questions to include in the questionnaire include:
- How would you rate the safety of your lab work environment?
- What hazards and risks are acknowledged through standard operating procedures and protective equipment requirements? Are there additional hazards or risks associated with your research that you believe should be better mitigated?
- What ways can your lab improve practices to minimize exposure to hazards?
- Identify chemicals hazardous by inhalation.
- Describe lab activities that may cause inhalation exposure.
Set Boundaries for Lab Space Visits
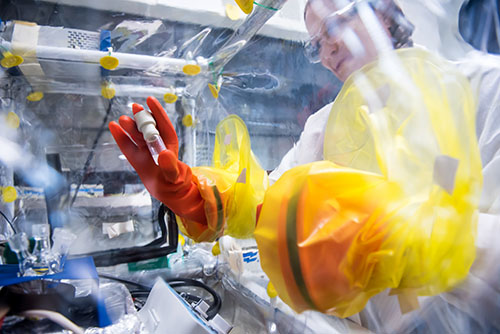
Photo credit: Andrea Starr | Pacific Northwest National Laboratory
Lab spaces are dynamic spaces that often host cutting-edge research involving hazardous situations that require special protective equipment. In conversations with researchers and operations personnel, set boundaries for lab space visits, including:
- When to conduct the walkthrough survey of lab and support facilities so as not to infringe on research productivity
- Where access to certain areas or photography may be prohibited
- What personal protective equipment (PPE) or special permissions may be required to survey each lab space.
See more in the Working with Scientists section.
Establish a Baseline
Survey Lab Spaces through a Laboratory Ventilation Risk Assessment
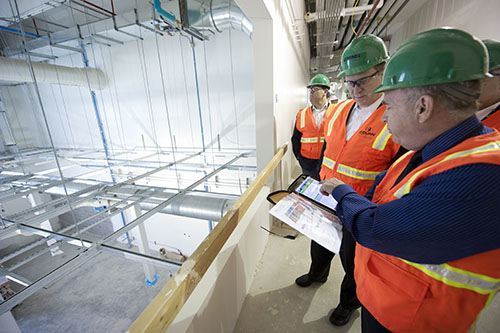
Photo credit: Dennis Schroeder / NREL
Survey Labs and Support Spaces to Evaluate Risk
The LVRA survey should be performed by a qualified individual—such as facilities or EH&S professionals—with knowledge of mechanical ventilation, core sciences, and occupational safety and health. It is recommended that LVRA findings and conclusions be reviewed by a licensed Professional Engineer and/or Certified Industrial Hygienist prior to implementation of any recommendations. To guide the survey of labs and assigning risk levels, refer to the LVRA User Guide and the LVRA tool.
Surveys are conducted via site walkthroughs that include observation of general laboratory conditions. For each lab space, data collection for both ECDs and laboratory environments consists of three steps:
- Description of ECDs or laboratory (i.e. type, size, access, monitoring)
- Evaluation of the device or lab space purpose, condition, and processes
- Assessment of the risk using determined criteria and rating presented below.
Data should be collected and recorded separately for ECDs and laboratory environment based on the following assessment categories:
- Type of hazards and procedures
- Generation characteristics of each hazard (method of generation, nature of hazard generated [e.g., gas, vapor, dust], potential for generation, etc.)
- Quantity of materials used or generated during lab procedures
- Frequency and duration of hazard generation
- Containment by ECDs (i.e. specific types, uses, and appropriateness).
Assessments in these categories inform ratings that are ranked by risk level, or risk control band (RCB):
| Risk Level | Description |
|---|---|
| 0 | Negligible |
| 1 | Low |
| 2 | Moderate |
| 3 | High |
| 4 | Extreme |
Data Collection for Exposure Control Devices
For each ECD in the space, perform the following data collection activities:
- Assign a unique identification number.
- Describe how the device is ducted, filtered, mounted, and document other identifiers.
- Examine location relative to other ventilation components.
- Conduct performance tests for all ECDs.
- Evaluate appropriateness of ECDs using the rating metrics provided below.
Data Collection for Laboratory Environment
Data collection for the laboratory environment survey follows a similar 3-step process as that of the ECD survey to evaluate risk. However, some differences are important to note. While the ECD survey focuses on effectiveness of hazard containment, the lab environment survey focuses on the directional sweeping of air across the workspace to remove contaminants.
Assign Risk Levels to Each Lab Space
The laboratory ventilation risk assessment process utilizes control bands to facilitate categorization of risk for laboratory spaces, fume hoods, and other ECDs. RCB categories provide a range for assignation of risk from negligible risk of exposure to airborne hazards generated during laboratory scale procedures (RCB-0) to extreme risk of exposure (RCB-4). Each RCB is associated with a hazard emission scenario that is used to recommend exposure control measures and derive operating specifications (airflow) for the laboratory fume hoods and HVAC systems serving the laboratories. Ventilated ECDs and spaces with higher RCB ratings require higher volumes of airflow with devices and spaces assigned lower RCB ratings require less air to meet the functional requirements of the ECDs and lab occupants.
Complete Laboratory Ventilation Risk Assessment Deliverables
LVRA deliverables include:
- Documentation of risk control band values for ECDs, fume hoods, and laboratory environments using the LVRA tool.
Refer also to the ASHRAE Classification of Laboratory Ventilation Design Levels. - Risk matrices including minimum occupied and unoccupied ventilation exhaust rates for ECDs, fume hoods, laboratory environments, and exhaust systems serving ECDs and laboratories
- Recommendations for integrating LVRA data into an overall LVMP.
Tools and Guides
The following guides and tools are provided to support organizations in completing the LVRA deliverables.
Laboratory Ventilation Risk Assessment User Guide
Reviewing the LVRA User Guide before beginning ventilation assessment of a lab space orients the surveyor to the process and informs them of what to look for and what types of information should be gathered during the survey.
Laboratory Ventilation Risk Assessment Tool
This Laboratory Ventilation Risk Assessment (LVRA) tool guides users through the process presented in the LVRA User Guide to effectively evaluate the ventilation risk present in each lab space. The resulting risk control bands for ECDs and the lab environment are then used to calculate the recommended air change rates. The results from this tool are recommendations only; results should be verified effective by a qualified professional.
Hazard Emissions Scenarios Dilution Calculator
Theory and conditional modeling used by the process are applied using a dilution calculator for the determination of representative Hazard Emissions Scenarios (HES).
The LVRA deliverables feed directly into the scope of work deliverable of the Assess phase.
Perform System Testing
The laboratory ventilation risk assessment provides a target of operation. System testing should be performed to establish a baseline of current operation, functionality, and boundary conditions of the ventilation systems. A comparison of the current operation baseline and the target operation identified in the LVRA will allow the team to identify improvement measures.
These tests will continue to be used for the Laboratory Ventilation Management Program (LVMP) to verify proper system operation and performance, and it is important to perform them correctly to gain accurate metrics for gauging improvement.
System testing falls into three basic categories:
Exposure Control Device Performance Tests
Performance testing provides validation of safe operations and a baseline set of data that will be used as a reference for annual preventative maintenance testing or for comparison following laboratory modifications. Table 1 indicates appropriate tests for each ECD.
| Recommended Tests | ||||||
|---|---|---|---|---|---|---|
| Tests | Laboratory Fume Hood (LFH) | Ventilated Balance Enclosure (VBE) | Custom Ventilated Enclosure (CVE) | Biological Safety Cabinet (BSC) | Local Exhaust Ventilation (LEV) | |
| Installation inspection | standard | standard | standard | standard | standard | |
| Velocity at face (plus downflow for BSC) | standard | standard | standard | standard* | good | |
| Low-volume flow visualization (smoke/fog) | standard | good | good | standard | good | |
| High-volume flow visualization (smoke/fog) | good | N/A | better | N/A | N/A | |
| Tracer gas | Static test | standard | good** | standard | good** | good |
| Dynamic test | good | N/A | better | N/A | N/A | |
| Challenge test | good | better | better | better | better | |
| Face velocity alarm or flow alarm | standard | standard | good | standard | better | |
| Exhaust filter integrity | N/A | standard*** | N/A | standard | N/A | |
| Supply filter integrity | N/A | N/A | N/A | standard | N/A | |
| Duct air flow volume | good | good | good | good | standard | |
| Sound level | good | better | good | standard | better | |
| Lighting level | better | better | better | standard | N/A | |
|
* Indirect measurement (see NSF 49 or EN12469 for specifics) |
||||||
ASHRAE 110 Testing. Photo Credit: Tom Smith, 3Flow
ASHRAE 110 Testing for Fume Hoods
Learn about how the National Renewable Energy Lab In-house Fume Hood Testing Ensures Safety and Savings.
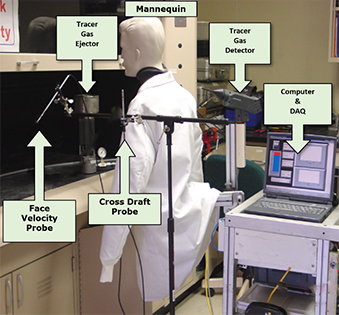
Fume hoods tend to be more complicated than other ECDs in terms of their protective capability. While offering greater protective capability than most ECDs, they usually require more involved testing procedures than other devices. While it is common for many organizations to annually test a fume hood's face velocity to confirm proper operation, face velocity only is not a guarantee of proper fume hood operation. In addition to face velocity measurements, a good annual test should include cross draft measurements, a smoke visualization test, and a VAV response and stability test on hoods that are equipped with VAV controls to ensure that those controls are operating properly.
For testing of fume hoods, refer to the ASHRAE Standard 110, Methods of Testing Performance of Laboratory Fume Hoods, which recommends a testing regimen without an absolute standard for a pass/fail grade in recognition that testing criteria must be appropriate to the intended use (See Figure 1). ANSI/AIHA Standard Z9.5-2012 provides useful guidance on establishing performance criteria in Section 6.1.2.7 for Tracer Gas Containment Tests:
"A control level for 5-minute average tests at each location conducted at a generation rate of 4 [liters per minute] shall be no greater than 0.05 ppm [parts per million] for 'as manufactured' [AM] tests and 0.10 ppm for 'as installed' [AI] (AM 0.05, AI 0.1). AM 0.05 can be achieved with a properly designed laboratory fume hood. It should not be implied that this exposure level is safe. Safe exposure levels are application specific and should be evaluated by properly trained personnel (SEFA 1-2002)."
Lab Environment Tests
Conducting a Laboratory Environmental Test (LET) during Commissioning
This guide outlines the purpose, scope, and procedures for performing a laboratory environment test and includes measurement sample forms.
Laboratory environment tests evaluate ventilation system controls in the laboratory space and the proper modulation of airflow in response to changes in demand. Tests involve measurement of the room's total air supply and exhaust volumes (including all ventilated devices) and room differential pressures and temperatures with the systems placed in all modes of operation (i.e., heating/fume hood sash closed/minimum, cooling/sash open/maximum). Measured data is compared to design specifications and BAS-reported information to assess accuracy and precision of the sensors, airflow stations and other reporting mechanisms.
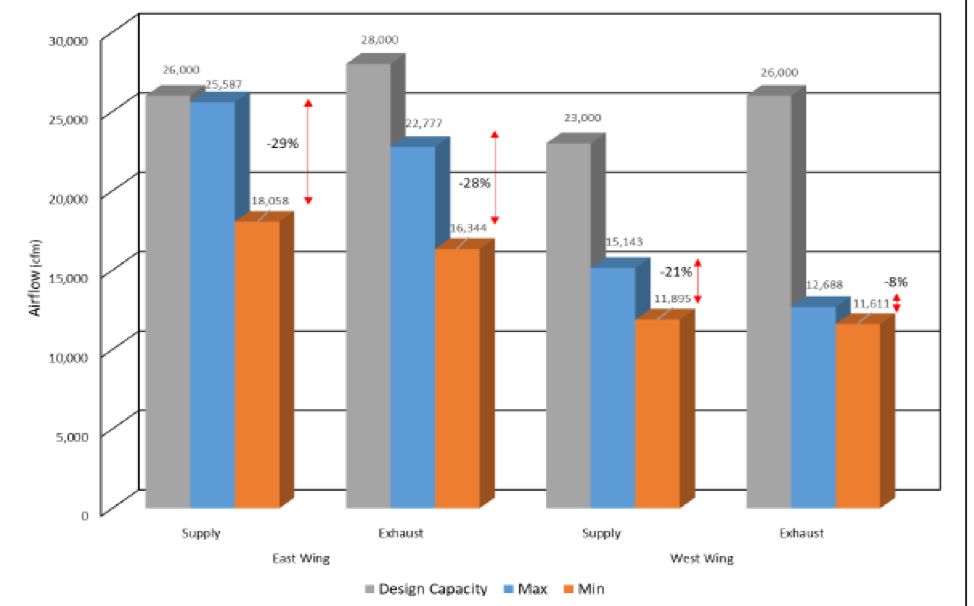
Example of supply and exhaust flow data from system operating mode tests
Photo credit: Tom Smith, 3Flow
System Operating Mode Tests
Conducting a System Operating Mode Test (SOMT)
This guide outlines the purpose, scope, and procedures for performing a system operating mode test and includes measurement sample forms.
System operating mode tests evaluate current operation of the HVAC systems and assess the response of the HVAC equipment (exhaust fans/air handlers) to changes in ventilation demand in the laboratory or ECDs. Modulation of airflows in the laboratory or fume hoods resulting from changes in demand may not be translating to a proportional modulation of flow at the system level. Tests are conducted on the air handling units and exhaust fans to evaluate current operation and determine current flow rates, system static pressures, and functionality.
System operating mode tests provide performance analysis when the systems are challenged through various modes of operation; occupied settings, unoccupied set-back mode (all sashes open or closed), heating/sash closed/minimum and cooling/sash open/maximum. Measured airflows are compared with design specifications and BAS-reported flow to assess accuracy and precision of the sensors, airflow stations, and other reporting devices.
System operating mode tests provide baseline data for comparison to future, post-modification measurements and are a key component of the LVMP. Information collected from subsequent system operating mode tests can be compared to the design or baseline system operating mode tests to determine if the ventilation systems are operating correctly or if there is a variance that needs to be investigated (See Figure).
Building Automation System Trends
BAS trends are initiated and results analyzed to assess system performance and modulation of airflow prior to, during, and after conducting the lab challenge tests. Analysis of the data can reveal:
- Range of modulation
- Sensor failures or calibration issues
- Defective equipment such as valve actuators
- Issues with sequence of operation.
Users could consider trending the following points in the BAS:
- Exhaust flow rates and corresponding supply flow rates (measured in CFM)
- Volume flow rate per hour (measured in air changes per hour or CFM/ft2)
- Fan energy or VFD speed
- Space temperatures
- Occupational status (unoccupied vs unoccupied)
- Energy consumption of all fan systems (measure in kW or kWh)
- Energy consumption of the whole building as summed by sub-systems, such as fans, lighting, plug loads, heating and cooling systems, and other end uses
Identify Improvement Measures
Calculate Airflow and Operating Specifications
The demand for ventilation establishes the current airflow requirements that can be used to design systems or compare how the systems are currently operating. Quantifying demand for ventilation enables evaluation of the potential for flow reduction and energy conservation. Airflow specifications should be tracked in an airflow spreadsheet. Documenting, recording, and managing airflow specifications is a critical component of an LVMP. Changes to airflows for laboratories or ventilated ECDs resulting from changes in demand (i.e. physical changes or changes to processes conducted in the labs or devices) must be reflected in the airflow spreadsheet to reflect current conditions.
Refer to the Lab Ventilation Risk Assessment (LVRA) Tool in determining what air changes are required for given risk level in the lab environment.
Air Supply Flow
It is a common design practice to supply labs with 100% outdoor air to ensure a clean supply of air for conditioning and pressure control. Modern designs now utilize more transfer air from non-lab spaces to satisfy a portion of the air requirements for conditioning and pressure control, while maintaining safe lab environments.
The location and type of supply diffusers are important design characteristics. Good design practice places the supply diffusers away from fume hoods and general exhaust to maximize the utility of the condition air. At the same time, the locations should minimize air mixing and promote flow directly to general exhaust or exhausted devices. Diffuser design should supply air with low velocity and no induction of lab air. These attributes enhance ventilation and create opportunities to reduce lab ACH.
Exhaust Flow and Stack Discharge
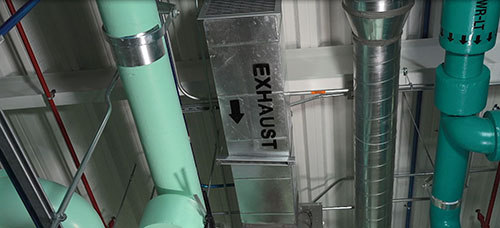
Exhaust systems are vital to a lab HVAC system. Properly designed, constructed, and operated ventilation systems effectively:
- Remove airborne hazards contained by ECDs from the lab space
- Mitigate environmental contamination
- Reduce risk of exposure to hazards for maintenance and construction personnel
- Prevent re-entrainment of contaminants into occupied spaces.
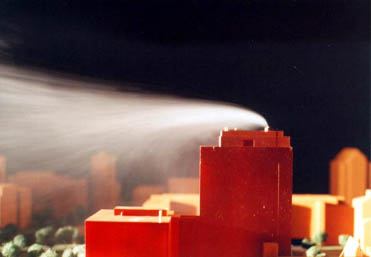
Modeling is a preferred method to determine optimal exhaust patterns. These may be optimized to consider occupancy and dilution due to manifolding of building exhaust. For more information, see HVAC Resource Map: Exhaust Stack Basics.
Exhaust systems can be a large initial and ongoing investment. An exhaust dispersion assessment helps to minimize waste by analyzing the system and defining the flow requirements so that each exhaust fan can run at less than 100% load while still maintaining good air quality and compliance with ANSI/AIHA Standard Z9.5-2012, which provides guidelines for designing and operating lab ventilation systems.
Per ANSI/AIHA Z9.5, exhaust fans serving laboratories shall be adequately sized to provide the necessary amount of exhaust airflow, enough to maintain both the required exhaust airflow and stack exit velocity and the necessary negative static pressure (i.e. suction) in all parts of the exhaust system. Specifically, the exhaust stack discharge shall meet the following criteria from the ANSI/AIHA Z9.5 standard:
- Any exhaust discharge shall be a minimum of 10ft (3m) above adjacent roof lines and air intakes and in a vertical up direction
- Exhaust stack discharge velocity shall be at least 3000 ft/min (15.2 m/s), unless it can be demonstrated that a specific design meets the dilution criteria necessary to reduce the concentration of hazardous materials in the exhaust to safe levels at all potential receptors.
Emissions from external sources that may be re-ingested into the building between the building's exhaust stacks and air intakes are often overlooked in indoor air quality. Dispersion modeling predicts the amount of fume re-entry, or the concentration levels expected at critical receptor locations, with the goal of defining a "good" exhaust and intake design that limits concentrations below an established design criterion.
Refer to the hazard dilution calculator for determining the dilution of airborne hazards in different emission scenarios.
Execute an Energy Assessment
Review each building system for energy usage by selecting each icon.
HVAC
After assessing the effectiveness of the ventilation system, it is important to look at the energy consumption of the heating, ventilating, and air conditioning (HVAC) systems. Many energy saving strategies can be integrated into the HVAC system, including energy recovery systems, that can greatly reduce energy bills for a laboratory. For an extensive list of measures to implement for energy efficient ventilation, check out the HVAC resource map.
Lighting
Installing LED lighting throughout lab spaces, including unexpected applications like microscopy, is a simple, effective way to reduce energy costs. LED products—especially those that are ENERGY STAR® rated—use at least 75% less energy, and last 25 times longer, than incandescent lighting.
Plug Loads
Plug loads refer to energy used by equipment that is plugged into an outlet. In a laboratory, plug loads include any equipment such as water baths, ice machines, centrifuges, microscopes, and more. Lab spaces typically have higher plug load energy use than other building types such as offices, due to the high number of equipment. A plug load assessment categorizes what devices are consuming energy and how much they consume. There are also many options for controlling plug loads in a space. Additionally, there are options to replace high energy consumers where possible. Work with vendors to acquire equipment that has a reduced power mode as standby mode often consumes almost as much power as when operating. Learn more about plug loads.
Controls
Implementing controls through a building automation system is essential to maintaining dynamic systems that supply exactly what energy is needed at exactly the right time. For example, installing occupancy sensors that control fume hood face velocity can both reduce unnecessary energy use when no occupants are present and increase safety by ensuring the fume hood effectively contains contaminants when occupants are in the vicinity.
Building Envelope
Building envelope can play a significant role in the energy consumption of the lab facility, especially in extreme climates. Assess each lab space with an infrared camera or enlist the help of a professional energy auditor to determine if there are any areas that are leaking heat in or out of the lab space. Retrofitting with added insulation can reduce energy use.
Renewable Energy
After implementing all possible energy efficiency measures within the lab facilities, consider the possibility of installing a renewable energy source, such as solar panels or wind turbines, to offset energy use. Offsetting energy use with renewables can support the goal of a zero energy facility.
Perform a Water Assessment
Photo credit: Dennis Schroeder / NREL
Most laboratory buildings use significantly more water per square foot than standard commercial buildings, primarily due to their larger cooling and process loads and operation of specialized equipment. This provides laboratories with a greater opportunity to make cost-effective improvements in water efficiency.
The first step in improving water efficiency is to assess water usage in the laboratory. The following information is a general guide to water assessment. More information, including tools, survey and inventory worksheets, is provided through on the United States Environmental Protection Agency (EPA) WaterSense website.
Gather Available Data
Coordinate with operations staff to gather information on:
- Types of water sources used:
- Potable
- Non-potable
- Onsite alternative water, such as rainwater or gray water
- Purchased reclaimed water from wastewater treatment plant.
- Data from water bills and logbooks from metered and sub-metered water sources to get a baseline of seasonal trends, including:
- Quantity of each water source
- Cost of each water source
Establish a Baseline
Perform a Water Audit Survey
- Conduct a tour of the facility to inventory all major water-using fixtures, equipment, systems, and processes.
- Be sure to capture enough detail on processes to determine how much water is consumed by each end use.
- Pay attention to drain lines plumbed to floor drains in building mechanical and utility spaces. Trace these drain lines back to the originating equipment to make sure they are included in the inventory.
- Identify locations of all meters and submeters—read the meters and submeters, and check that the units and scale of the readings match water bills and internal logbooks.
- Use survey forms or checklists, such as the Existing Plumbing Equipment and Water Use Inventory Worksheets provided by EPA WaterSense. This information will be useful in calculating the facility's total water use.
- Interview any personnel that manage water-using systems or equipment to understand how the systems and equipment are operated and maintained and to verify water use. Be sure to record the hours of operation for each system or fixture to more accurately calculate water use over time.
Establish a water use baseline
To develop a water use baseline, consider the following activities.
- Document lab's water use history using the water bills gathered from one or two years prior using a form such as the Water Consumption History Worksheet or a tool such as ENERGY STAR Portfolio Manager.
- Calculate the facility's total annual water use. The facility water balance is an accounting of all water uses at the facility.
- Metered or sub metered sources: Calculate typical annual water use from meter readings, water bills, or internal logbooks for identified fixtures, equipment, systems, and processes.
- Unmetered sources: Estimate the annual water use from flow rate measurements collected during the facility tour (if available) or use equipment specifications and patterns of use. Consult the tools provided by the WaterSense program to help develop water use estimates for specific fixtures or equipment.
Identify Improvement Measures
Based on the results of the water audit, compare the water use baseline with water use reduction goals. This will inform improvement measures to include in the scope of work. For guidance on best practices surrounding water-intensive research equipment, refer to the Equipment Specific Practices section on the Working with Scientists page.
Common Areas of Improvement in Water Efficiency
A laboratory's water efficiency can be improved by making a few changes in other types of equipment as well, as described in the I2SL Water Efficiency Guide for Laboratories.
Alternative Water Sources
Alternative water sources such as rainwater and gray water can often be effectively integrated into a laboratory's operations. Be sure to check with state and local regulations concerning alternative water use. More information on potential alternative water sources that may be available in the area can be found through FEMP Alternative Water Sources Maps.
Perform a Resilience Assessment

Photo credit: Randy Montoya | Sandia National Labs
Resilience activities can complement efficiency work in a lab. Lab facilities usually are regarded as mission critical by their owner/operators and often face very high requirements for reliability and resilience. Loss of power in a lab can compromise safety because of the loss of ventilation air and can forestall or void ongoing research through loss of research samples in freezers. Energy efficiency and resilience in labs can preserve necessary levels of functionality and safety when there is a power outage. Data centers and labs, thus, present proven resilience strategies and testbeds for emerging technologies and operational innovations to enhance and balance resilience with effective energy management.
For labs, the lower the energy demand or load, the easier it is to ensure resilience, by meeting emergency demand with smaller or fewer backup systems. Lab facilities almost always have backup generators as part of code. These diesel generators often consume electricity continuously, for instance, to maintain instantaneous fuel availability. Opportunities exist to develop more flexible, efficient and synergistic backup systems. Storage can enable more dynamic resilience and a greater role for cleaner onsite and offsite generation. Fuel cells can serve as backup generators, as well. Designed and integrated properly, both may replace diesel generators and, thus, improve overall system efficiency.
Consider how the Smart Labs program fits into any other resilience efforts the site may have. As projects are discussed, the Smart Labs team should include a resilience assessment to determine facility vulnerabilities. From this assessment, improvement measures can be implemented to mitigate risk due to natural disasters and other unforeseen events. These measures should be included in ongoing design decisions.
Conduct a Vulnerability Assessment
Are there specific vulnerabilities at the site that should be addressed in tandem with Smart Labs projects?
Exploring vulnerabilities among multiple stakeholders is augmented by the work completed through the baselining exercises by jurisdictions and governmental entities. Outcomes from these activities provide a foundation for understanding each jurisdiction's vulnerabilities. These could include system shocks, stressors, natural or technological hazards, threats, or human-caused incidents. These are detailed further as potential vulnerabilities:
- Natural hazards, resulting from acts of nature and severe weather (e.g., severe winter storm, floods, earthquakes, hurricanes, solar flares, etc.)
- Technological hazards, resulting from accidents or system and structural failures (e.g., bridge collapse, grid outage)
- Human-caused incidents, resulting from threats or intentional actions of an adversary (e.g., cybersecurity threats, acts of terror).
Additional vulnerabilities may include longer term system stress posed by conditions such as population change and changing economic conditions. However, the focus centers on the short- and long-term hazards of potential threats and their impacts on infrastructure vulnerability.
Risk Assessment
Safety of the most vital assets of your organization – the researchers and staff – is of primary importance when conducting cutting-edge science. All risks and associated controls to mitigate should be documented. When assessing risks in the lab spaces, here is a starting point for what questions to ask.
- What are the risks? Understand if there is PPE required for each risk.
- Who has access to lab spaces where risks are present? Only employees who have been trained to work in a specific lab space should be allowed to access the lab unless they are escorted by trained employee.
- How will risks be mitigated? Typical risks may include:
- Ventilation risk from chemical use or other airborne hazards
- Electrical hazards
- Compressed gases and liquids
- Radiation exposure, including lasers.
In assessing the risks, be sure to talk with the scientists, as discussed on the Working with Scientists page. They know their work better than anyone and will be a good resource in assessing the risks that are present in each lab space. However, scientists should not be the only resource. Be sure to supplement understanding through discussions with other professionals such as industrial hygienists and research support staff.
Identify Mitigation Measures
A wide range of measures can improve electricity assets and systems' resilience to climate impacts. These measures include making physical and structural improvements to "harden" the system components as well as planning and modifying operations to build resilience. Strategies for mitigating impact in the event of unforeseen events are described below.
Planning and Modifying Operations
Establishing a plan is critical to protecting essential assets in the event of unforeseen circumstances. In addition to establishing a plan for key assets and equipment, operational modifications should also be considered. These include:
- Updating designs and resource plans
- Implementation of smart grid communications and monitoring technologies that improve grid observability and controllability
- Energy efficiency programs
- Enhanced vegetation management
- Creating an inventory of spare parts
- Deploying demand response management tools
- Mutual aid agreements
- Risk transfer measures such as insurance.
Resilience measures may be generalized during a preliminary investigation stage, but utilities will need to consider the specific site characteristics of individual assets and systems when it is time for detailed analysis.
Hardening Existing Assets
Hardening measures include initiatives to make physical and structural improvements to lines, poles, towers, substations, generation and supporting facilities, including elevating existing equipment or building and reinforcing floodwalls. Consider the following activities to harden or protect existing assets:
- Elevate, retrofit, or reinforce existing structures
- Relocate assets
- Restore coastal wetlands or other natural barriers
- Enable greater distributed generation, islanding, and microgrids.
Barriers and Elevating Key Assets
Labs can reduce vulnerabilities to sea level rise, storm surge, and floods by elevating existing and new equipment, building floodwalls to prevent exposure, and increasing the use of submersible equipment (e.g., substations, transformers, switches, pumps, etc.). Hardening against flooding and inundation can also include sealing conduits and cable penetrations, and shrink-wrapping cabinets and weatherproofing enclosures.
Ensuring Energy Security and Resilience
Energy is essential to the continued operation of all critical infrastructure. Designing resilient electrical power systems to support critical infrastructure is the necessary first step in resolving gaps for integrating resiliency. Examples of resilient energy projects include implementing energy efficiency measures, developing distributed energy resources from renewable or non-renewable sources, and energy storage solutions for deploying a smart microgrid as a complete, resilient energy system. Energy resilience investments need to improve performance in extraordinary events as well as enhance system performance and cost-effectiveness during normal activity.
- Backup air conditioning
- Onsite power generation
- Developing an emergency power down plan
Distributed Generation
Increased use of distributed generation (e.g., solar photovoltaics, wind, fuel cells, plug-in electric vehicles, etc.) can provide additional capacity to enhance resilience during major outages. In some cases, these systems can disconnect from the bulk power system and serve as an independent backup power system.
Microgrids
A smart microgrid is a complete, resilient energy system that cost-effectively meets the most challenging energy needs. A grid-connected microgrid is configured to operate in unison with the commercial power grid. In the event of a power outage, the system allows the campus to operate independently as a completely "islanded" electricity grid and maintain critical operations. An off-grid system is also feasible; however, the associated costs and potential reliability risks are likely to exceed those of grid-connected systems. Extensive planning of operations is required to ensure the system meets 100% of the site's load and that all energy needs are met 100% of the time.
Load Management
Load reduction measures can help reduce outages and aid restoration and can be achieved through approaches including voluntary load-reduction programs, direct load control, and time-of-use tariffs.
Deliverable: Scope of Work for Lab Upgrades
Once the current operating situation of the laboratory has been assessed, the difference between current operation and required operation provides the information to determine appropriate measures for improving performance.
Here the Smart Labs team should develop a report that describes how the systems are currently operating, compares current operation to the current demand for ventilation, identifies deficiencies, identifies applicable improvement measures, and provides a scope of work that will upgrade performance and result in demonstrable improvements.
Develop Improvement Measures
Improvement measures represent enhancements that lead to improved safety, more reliable operation, and improved energy efficiency. Bundling measures is usually the best way to achieve the greatest impact on performance.
Measures could range from simply getting internal staff to change setpoints, to work as complex as having contractors change constant volume systems over to variable volume air handling systems. Based on the improvement measures identified, the team will then create a scope of work to complete the measures. The team could take a prescriptive method, putting together a scope that outlines exactly what steps need to be completed, or the team could use a performance method, requesting that the service provider make modifications until the specified settings are achieved.
The statement of work should include the results from the assessment phase and the goals of the program and building.
Work could be grouped into three categories:
- System Refinements: Repair, TAB, and commissioning
- Ventilation Refinements: Modification of set points and operating specifications
- Major Modifications: Renovation, modification, construction.
To assist the Smart Labs team, see the HVAC Resource Map for Laboratories for potential improvement measures.
Footnotes
- Khankari, K. (n.d.). Analysis of Spread Index: A Measure of Laboratory Ventilation Effectiveness. 8. ↵